Signal Example — Power Spectrum
Interactive demo showing how a time-domain signal maps to a power spectrum via the FFT, and illustrating frequency resolution, spectral leakage, and windowing.
What it shows
| Row | Plot | Description |
|---|---|---|
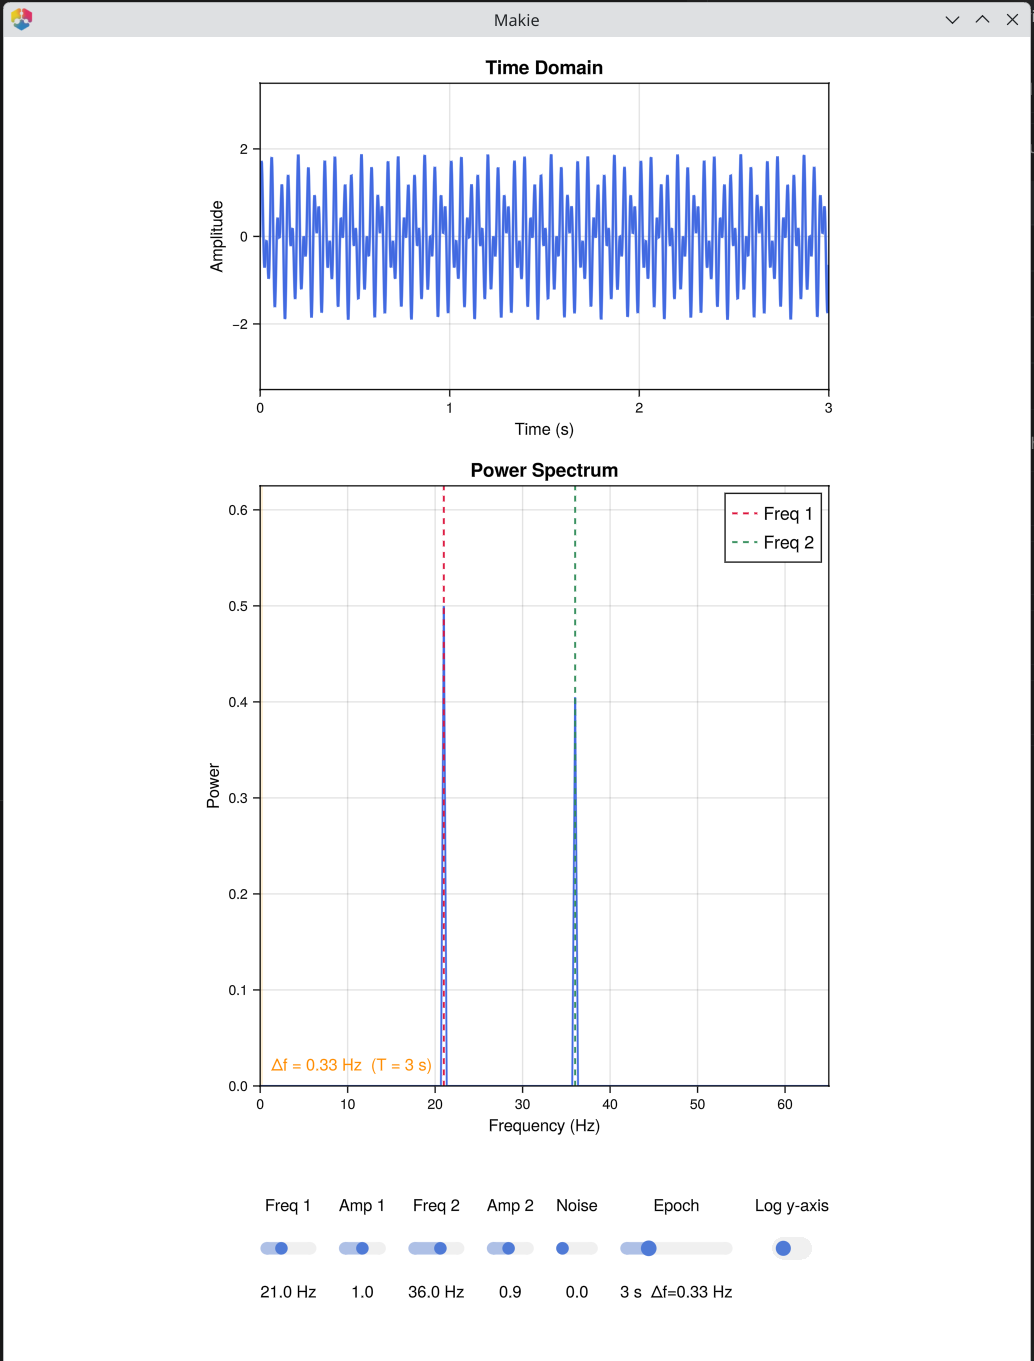
| 1 | Time Domain | The composed signal (up to 2 s displayed). |
| 2 | Power Spectrum | One-sided FFT power spectrum. Dashed lines mark the true frequencies; the orange band is one frequency-resolution bin (Δf = 1/T). |
Controls
| Control | Range | Description |
|---|---|---|
| Freq 1 | 1–60 Hz | Frequency of the first sine component |
| Amp 1 | 0–2 | Amplitude of the first component |
| Freq 2 | 1–60 Hz | Frequency of the second sine component |
| Amp 2 | 0–2 | Amplitude of the second component (0 = silent) |
| Noise | 0–2 | Noise standard deviation |
| Epoch | 1–10 s | Epoch length → sets frequency resolution Δf = 1/T |
| Hanning | toggle | Apply Hanning window to suppress spectral leakage |
| Log scale | toggle | Logarithmic y-axis (makes sidelobes visible) |
Key Concepts
Frequency resolution (Rayleigh frequency): Δf = 1/T where T is the epoch length. To resolve two frequencies, they must be at least Δf apart. The orange band on the spectrum shows the current bin width.
Spectral leakage: When a frequency does not land exactly on a bin, energy spreads into neighbouring bins. This happens whenever the signal frequency is not an integer multiple of Δf.
Windowing: A Hanning window tapers the signal to zero at both ends, eliminating the discontinuity that causes leakage. The cost is a slightly wider main lobe. For EEG, a Hanning (or similar) window is almost always applied before FFT.
Both resolution and leakage matter in EEG: alpha (8–12 Hz) and beta (13–30 Hz) bands must be resolved from each other, and window choice affects how cleanly you can estimate power in narrow frequency bands.
See Also
Signal Example — Composition — building signals from sine waves
Signal Example — Dot Product — the core mechanism behind each FFT bin
Signal Example — Time-Frequency — TF analysis using FFT, Morlet, and multitaper
Cohen, M. X. (2014). Analyzing Neural Time Series Data. MIT Press. — Chapters 10–11
Code
using EegFun
EegFun.signal_example_spectrum()